Global Port Performance: June 2025
June 2025 port performance data reveals three insights about global maritime operations that supply chain professionals should understand: efficiency improvements can mask volume decline, infrastructure investment delivers genuine competitive advantage, and seasonal congestion patterns signal systematic capacity constraints. Our analysis of 95 major ports provides actionable intelligence for navigating an increasingly complex maritime landscape.
The Efficiency Illusion - When Apparent Improvements Hide Volume Loss
This month's data reveals that several ports showing dramatic efficiency improvements actually experienced declining vessel activity, suggesting that apparent performance gains are being masked by a fall in volume.
Durban's performance trajectory perfectly illustrates this. The port appeared to recover dramatically froJanuary's crisis-level 2.691-day anchor times to just 0.422 days by March—an impressive 84% improvement that would typically signal successful operational reforms.
However, June's data reveals the reality behind these numbers:
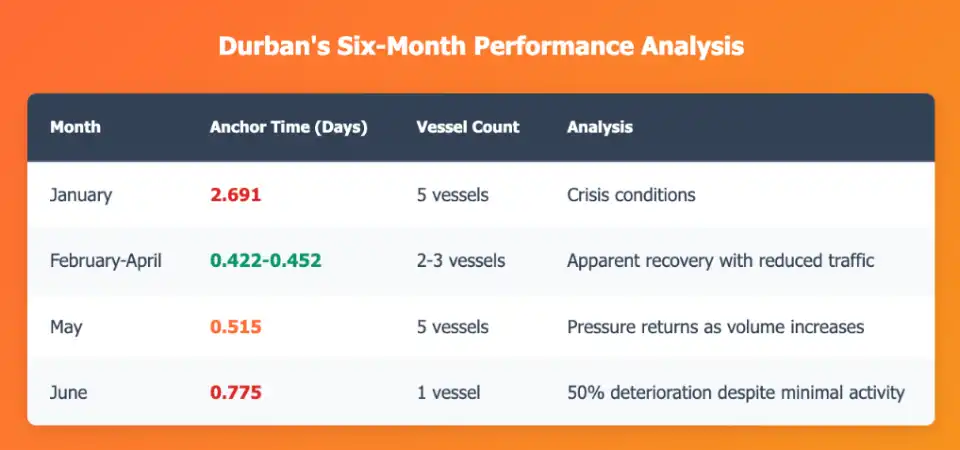
The World Bank ranks Durban 341 out of 348 ports globally, while recent reports indicate it will take until late-2025 for terminals to regain optimum functionality following equipment failures and operational challenges.
The Infrastructure Dividend - How Strategic Investment Can Create Sustainable Performance
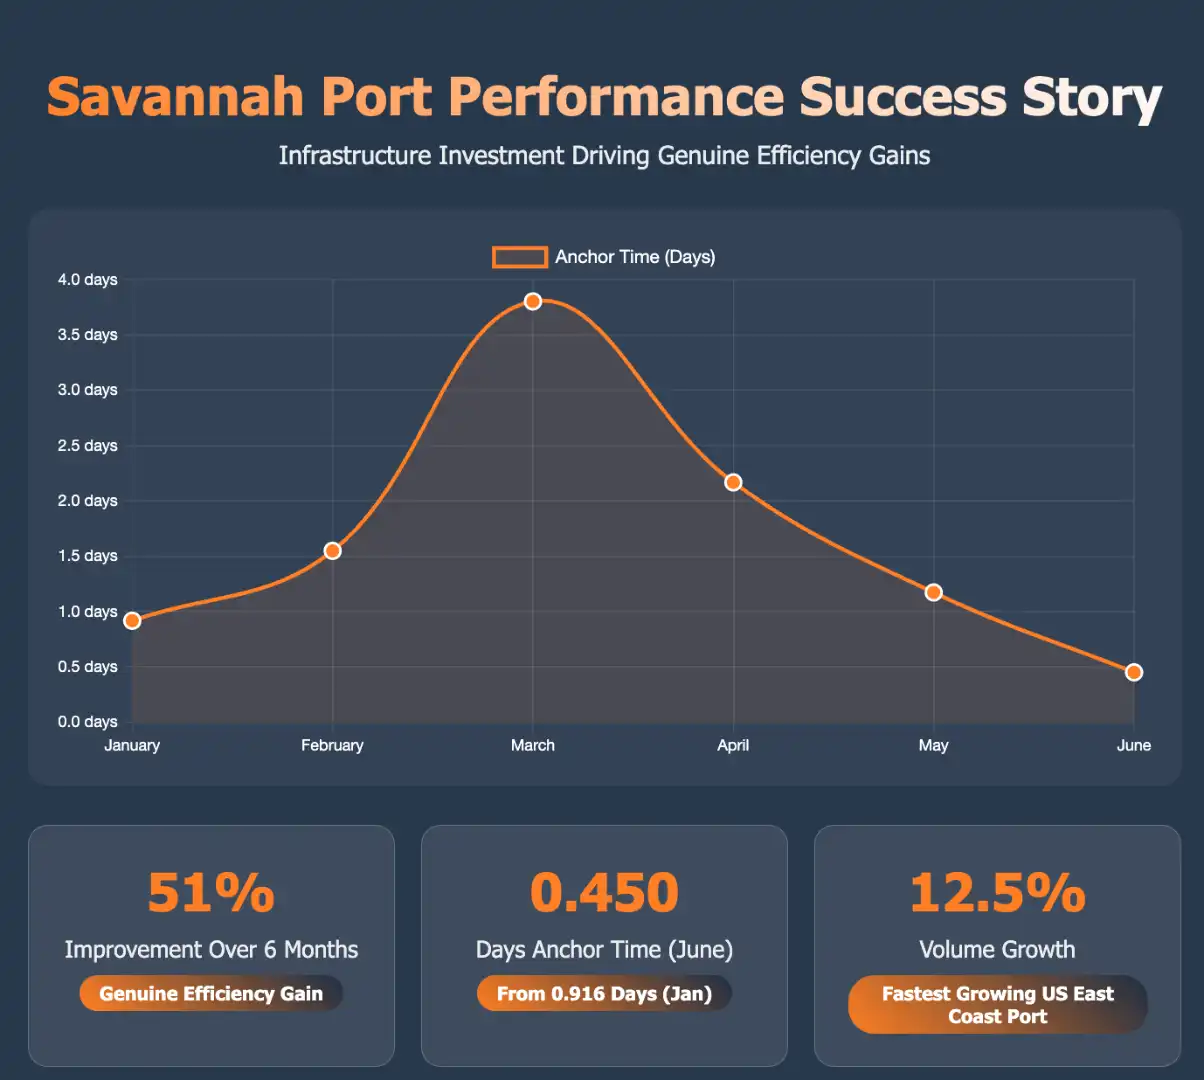
Savannah's remarkable performance this month demonstrates how substantial infrastructure investment combined with operational excellence delivers genuine, sustainable competitive advantage.
Savannah's Genuine Achievement
Savannah achieved authentic performance improvements through strategic infrastructure development:
The Georgia Ports Authority is investing $4.5 billion over the next decade in projects targeting berth space, yard capacity, trucking gate fluidity, and intermodal connectivity, making Savannah the fastest-growing port on the U.S. East Coast with 12.5% volume growth.
The Infrastructure Advantage
Savannah's success stems from comprehensive infrastructure investment that addresses potential capacity constraints:
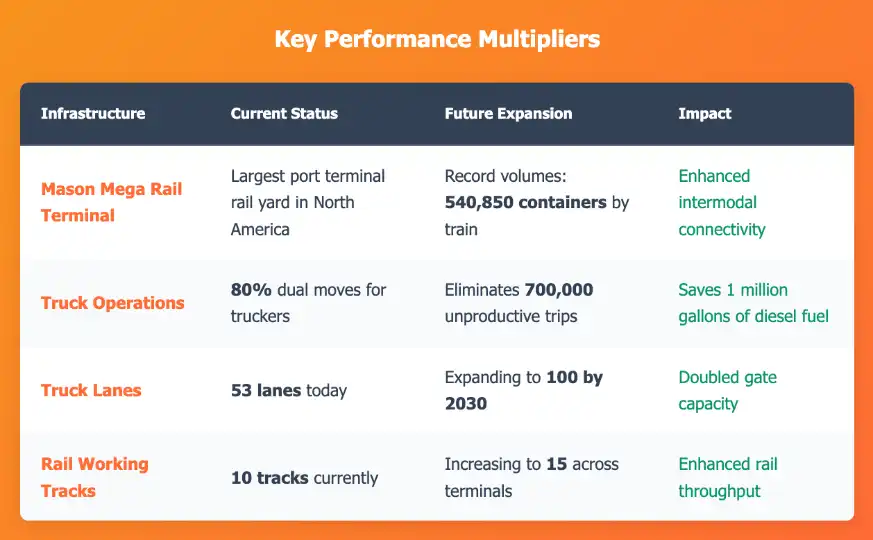
Savannah demonstrates how infrastructure investment can create the foundation for operational innovation. The port's ability to maintain efficiency during peak season stress while growing capacity positions it as a strategic asset for supply chain resilience.
The Capacity Issue:
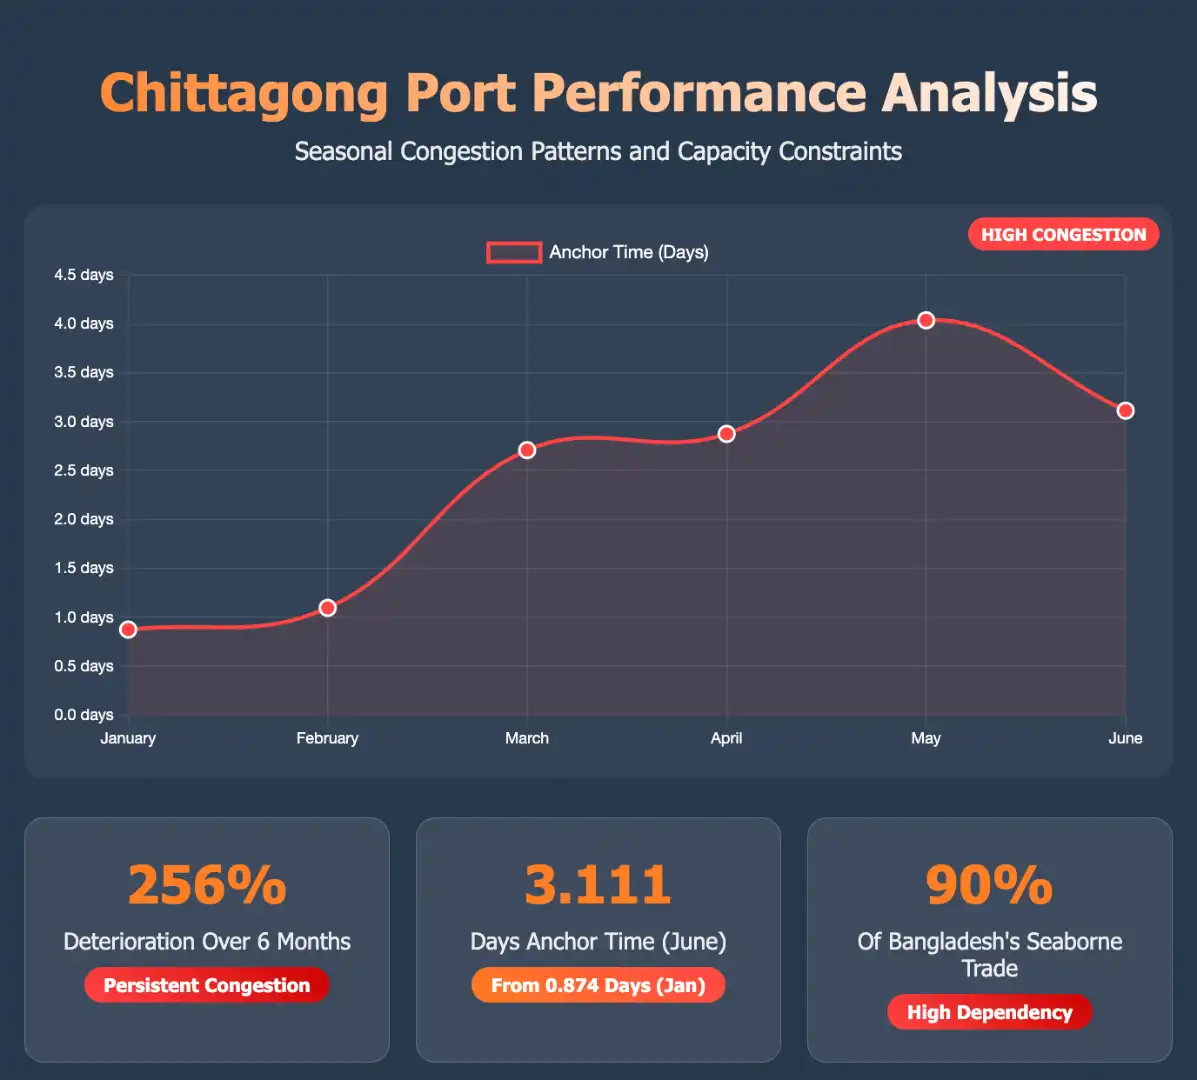
Chittagong's performance throughout the year, culminating in June's 3.111-day anchor times, demonstrates how seasonal congestion can affect eficiency.
The Breakdown
Chittagong's six-month trajectory reveals performance that worsens with seasonal demand:
Despite handling 90% of Bangladesh's seaborne trade, the port has experienced seasonal congestion between April and October since 2017, with ships waiting over a week during peak periods. The port's designed capacity was exceeded in 2014, yet expansion efforts remain insufficient.
The Strike Amplification Effect
February 2025's transport worker strikes provided a stress test of Chittagong's vulnerabilities, with 14 container ships waiting at outer anchorage for up to five days and terminals reaching 80% capacity. The disruption forced ships to depart without designated cargo while inland container depots stored double their usual outbound volume.
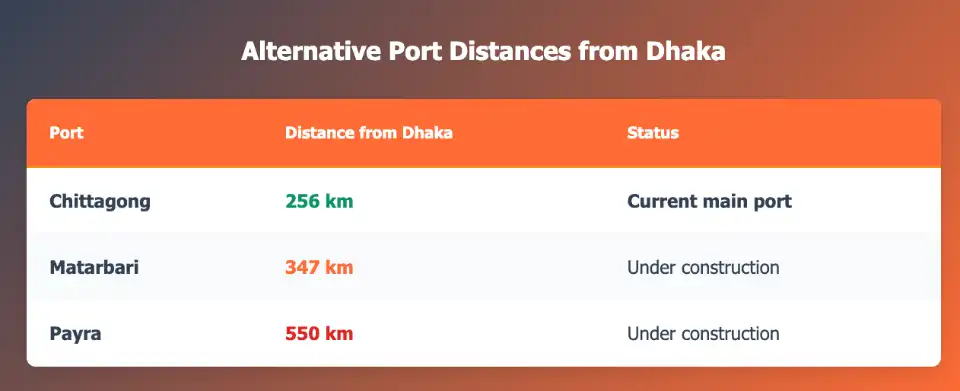
Limited port alternatives highlight how geographic constraints prevent easy load distribution, with new ports Matarbari and Payra located significantly further from Dhaka than Chittagong, raising concerns about effective freight shifting even after construction completion.
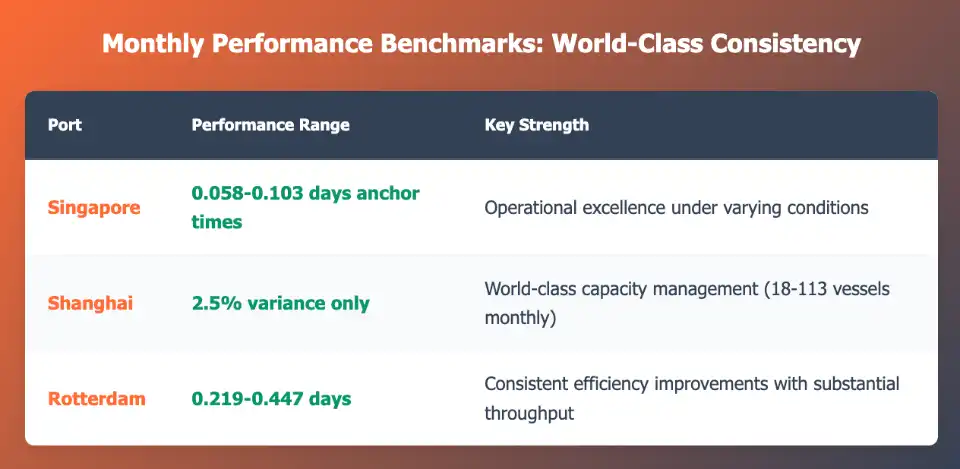
Monthly Performance Benchmarks: The Excellence Standards
World-Class Consistency Champions
Singapore: Maintained anchor times between 0.058-0.103 days throughout the six-month period, demonstrating operational excellence under varying conditions.
Shanghai: Exhibited remarkable stability with only 2.5% variance while managing massive vessel fluctuations (18-113 vessels monthly), showcasing world-class capacity management.
Rotterdam: Delivered consistent efficiency improvements with anchor times ranging 0.219-0.447 days while maintaining substantial throughput.
Strategic Intelligence for Supply Chain Professionals
Immediate Areas to Look Into
Avoid Volume-Loss Ports: Scrutinize ports showing dramatic efficiency improvements alongside declining vessel activity, as gains may prove temporary when demand returns.
Prioritize Infrastructure Leaders: Focus on ports with substantial ongoing capital investment where efficiency gains stem from capacity expansion rather than demand reduction.