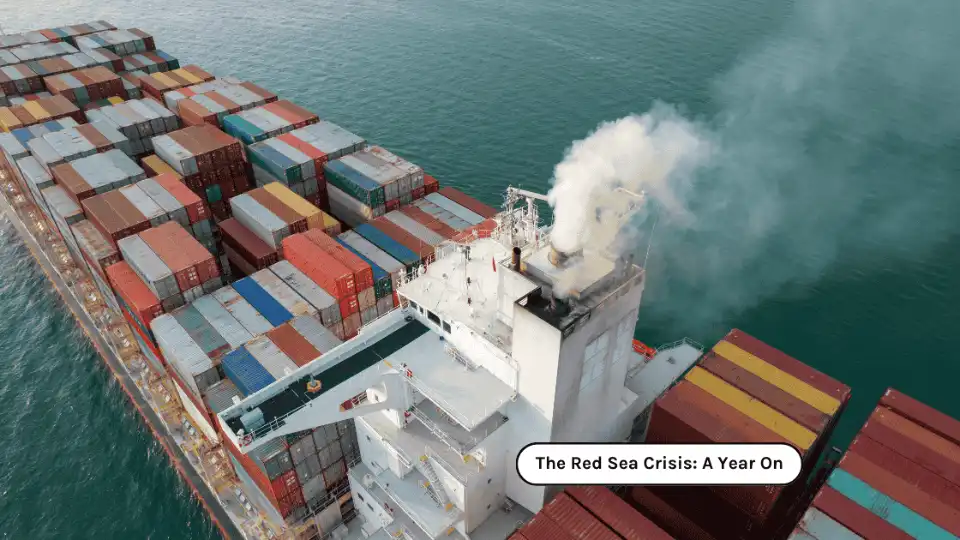
The Carbon Impact of the Red Sea Crisis in Container Shipping
Following the onset of the Red Sea crisis last November, major carriers elected to reroute vessels on Asia and Middle-East to Europe services around the Cape of Good Hope. This has not only elongated transit times by one to two weeks and contributed to worsening port congestion, but has also significantly increased the carbon footprint of these services.
How Much Farther Are Container Ships Traveling?
With emissions being a function of distance traveled, we can use the incremental distance on major trade routes to approximate the carbon impact of the crisis. Analyzing several major Europe/Asia port pairs shows that emissions on major routes have increased anywhere from 32% to 124%, with services connecting the Middle East and Europe seeing the largest change in both absolute and percentage terms.
Port Pair | Distance via Suez (nm) | Distance via Cape of Good Hope (nm) | Difference (nm) | Difference (%) |
Shanghai / Rotterdam | 10,525 | 13,843 | +3,318 | +32% |
Singapore / Rotterdam | 8,288 | 11,755 | +3,467 | +42% |
Jebel Ali / Rotterdam | 6,165 | 10,898 | +4,733 | +77% |
Shanghai / Valencia | 8,920 | 13,159 | +4,239 | +48% |
Singapore / Valencia | 6,683 | 11,071 | +4,388 | +66% |
Jebel Ali / Valencia | 4,560 | 10,214 | +5,654 | +124% |
Source: https://sea-distances.org/
But how much carbon does this amount to?
Excess Emissions from Container Shipping
As per Container News, in the first seven months of 2024, East Asia to Europe container throughput was around 10.34 million TEUs with an estimated 3.1 million TEUs traveling back to Asia. This equates to a full year estimate of 23 million TEUs on Asia/Europe services.
In 2022, Middle East/Europe trade volumes were 32% of the Far East/Europe trade lane. Assuming similar levels of growth on the two trade lanes, 7.3 million TEU can be expected to move between the Middle East and Europe in 2024.
This suggests a total of approximately30 million TEUswill have been impacted by the Red Sea crisis over the past 12 months. While a small amount of container traffic continues to traverse the Suez Canal on Coastal and Handysize ships, virtually all large capacity vessels are diverting meaning nearly all of this trade volume is subject to longer journeys.
Considering the emissions intensity of container ships, the average vessel produces 16.12 grams of CO₂ emissions per metric tonne of freight per kilometer traveled. For the purposes of this analysis, we will assume an average weight of 14 metric tons per TEU, the figure commonly used by carriers to determine homogenous cargo capacity of a container ship.
With these inputs, we can estimate that container ship diversions around the Cape of Good Hope have resulted inincremental emissions between 42.6 and 61.6 million metric tonsover what would have been expected had these vessels navigated via the Suez Canal.
Trade Lane | Impacted TEU (millions) | Excess Distance (km) | Excess Emissions |
Far East / Europe | 23.0 | 5,556 - 8,334 | 28.8 - 43.3 million |
Middle East / Europe | 7.3 | 8,334 - 11,112 | 13.7 - 18.3 million |
Total | 30.3 | - | 42.6 - 61.6 million |
Excess Emissions from Bulk & RoRo Shipping
Of course, container shipping only tells part of the story when it comes to the carbon impact of the Red Sea crisis.
Bulk cargo represents approximately 75% of all seaborne trade tonnage. While bulk carriers are diverting away from the Suez Canal at a lower rate than container ships, many have also adjusted their routes. Despite bulk carriers being less emitting than their container counterparts at an estimated 3.54 grams of CO2e per metric ton per kilometer, the diversion of these ships is still very carbon intensive.
While RoRo trade accounts for a smaller proportion of Asia-Europe trade volume than container and bulk, RoRo vessels are more carbon intensive.
What Does This Mean for Shippers?
It’s clear that a prolonged crisis will hinder efforts of the global shipping industry, already a major source of global carbon emissions, to become more sustainable. But there are also financial costs for both carriers and shippers associated with elevated emissions levels.
With shipping emissions falling under the expanded EU Emissions Trading System (ETS) from January 2024, carriers are incurring a cost for these excess emissions. With the percentage of emissions subject to the ETS increasing from 40% in 2024 to 70% in 2025 and 100% in 2026, the cost of emissions for carriers is set to increase considerably over the next two years. This cost is likely to be passed along to shippers through inflated freight costs and surcharges.
Carbon accounting is also set to take on increased importance for European companies with the introduction of the EU Corporate Sustainability Reporting Directive (CSRD) in 2025. Large companies will now be required to measure emissions, including Scope 3, and set targets for reduction. Sustained conflict in the Red Sea will make meeting emissions reduction targets a challenge.
Nearshoring strategies were already gaining momentum before the crisis. The carbon impact of a prolonged conflict in the Middle East combined with elevated costs and increasing scrutiny of corporate sustainability performance is yet another factor that could push businesses to rethink their reliance on long distance trade routes that are susceptible to geopolitical disruption.
Measuring Scope 3 Emissions in Your Supply Chain
Emissions transparency is quickly becoming a business imperative. Visibility solutions like Beacon make it easy to measure and report on Scope 3 emissions with automated carbon reporting for all of your freight transportation. Watch our 3-minute demo video or start your free trial today.